
With IDA, one can use the command line interface (CLI) not only to type scripting related commands but also to send debugger specific commands to the current debugger plugin.
Although the topic mentions device drivers, you do not have to know much about drivers to learn something new from this post.
For the sake of demonstration, we will start a kernel debugging session with IDA/Windbg plugin and execute the !drvobj command:
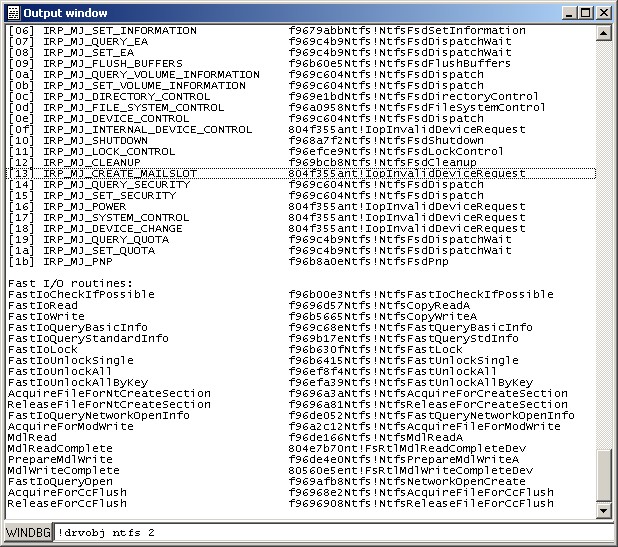
We now have the dispatch table for the NTFS driver, but what if we want to display all the dispatch tables of all drivers and be able to easily browse the list with IDA?
Before answering this, first let us see which debugger modules can receive commands through IDA’s CLI:
- GDB: SendGDBMonitor() sends commands to GDB monitor
- Bochs: BochsCommand() sends commands to Bochs internal debugger (“info idt” and parse the result for instance?)
- WinDbg: WinDbgCommand() sends commands to the windbg debugger engine
Please note that these commands are available only during the debugging session.
Now that we know how to send commands to WinDbg, let us see how to answer the previous question:
- Get a list of loaded drivers: We can use IDA SDK (get_first_module()/get_next_module()) and/or scripting (GetFirstModule()/GetModuleName()). We can also use the “lm” command
- Issue the “!drvobj DRVNAME” command and parse the result: In IDC we can simply write “auto s; s = WinDbgCommand(“!drvobj DRVNAME”)”. In Python we can use the Eval() to call an IDC function.
- Parse and store the result: We can use regular expressions
- Finally repeat the step 2 and 3 for all drivers.
The end result is a simple IDAPython script that automates this task:
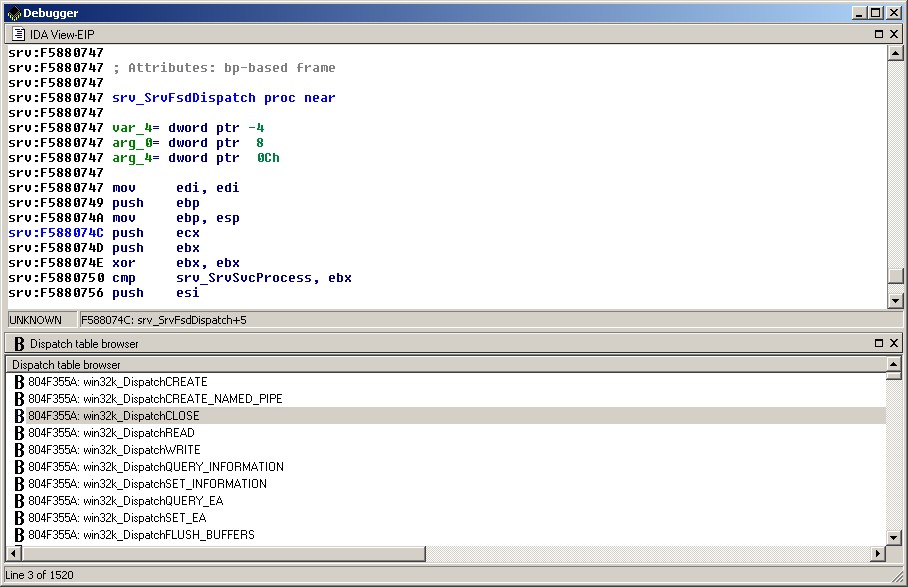
Download the script from here. All comments and suggestions are welcome.